Key figures
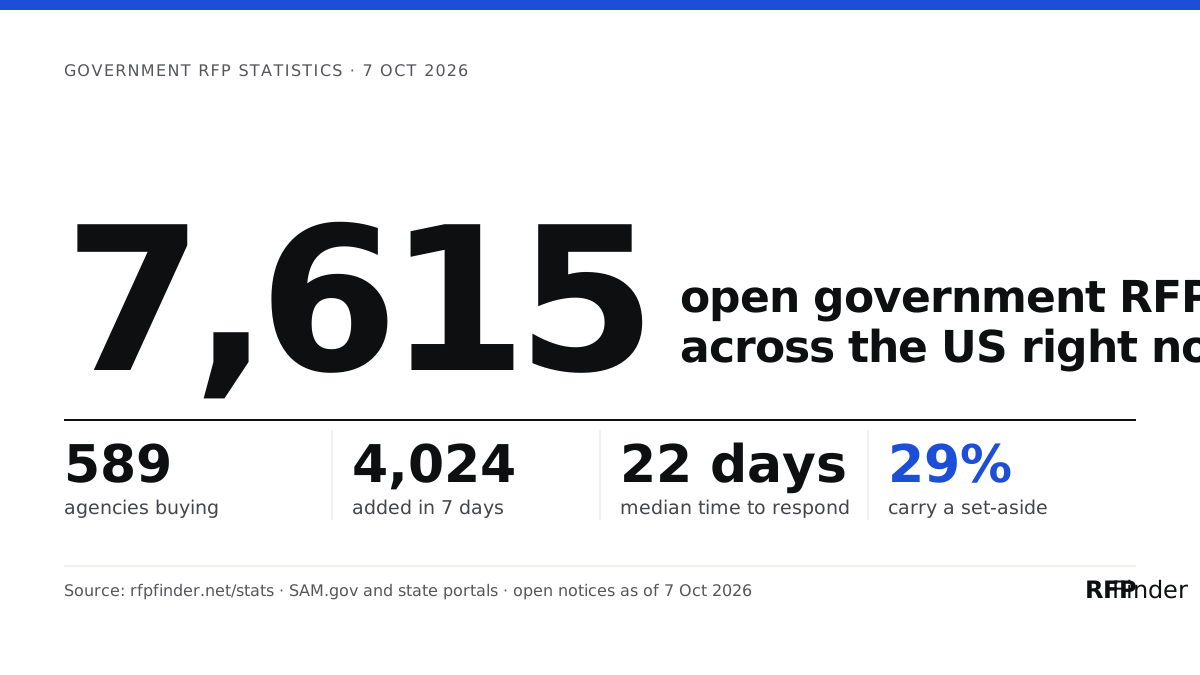
of open RFPs come from federal buyers (5,617 of 7,615).
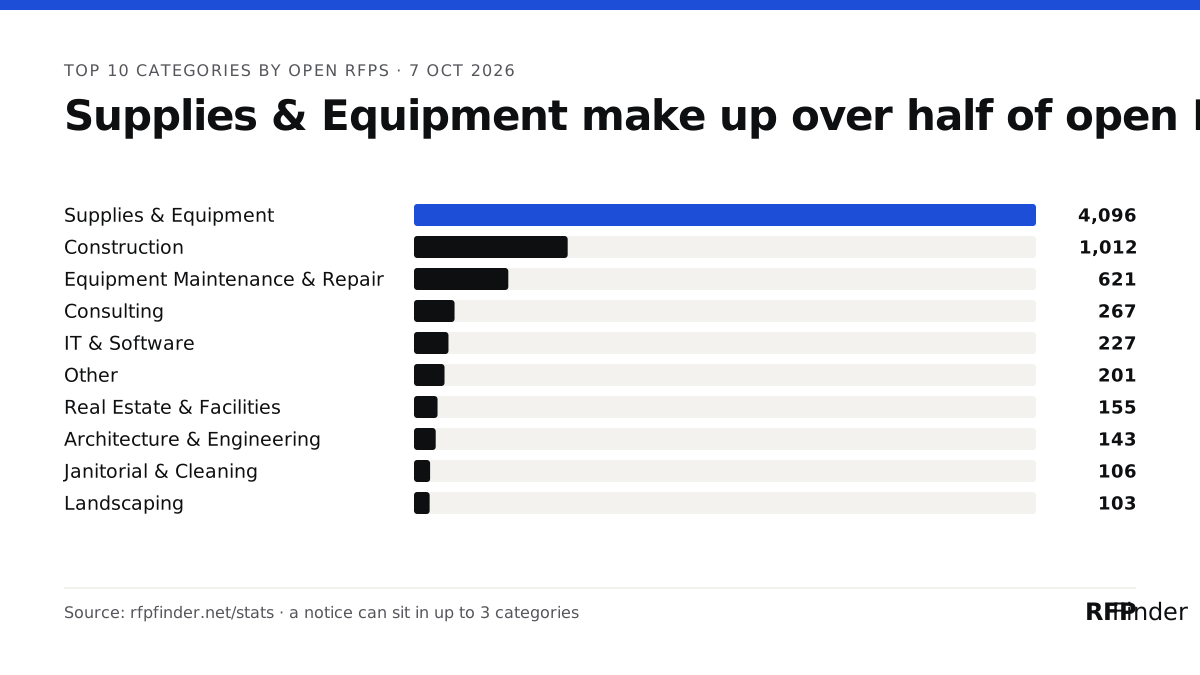
of open notices are tagged Supplies & Equipment, the largest category.
of open RFPs already carry an RFPFinder plain-English summary (5,122).
Charts for your story
Free to publish on any site, newsletter or slide deck. Each graphic carries its source and date; the numbers refresh nightly. All we ask is a link back to this page.
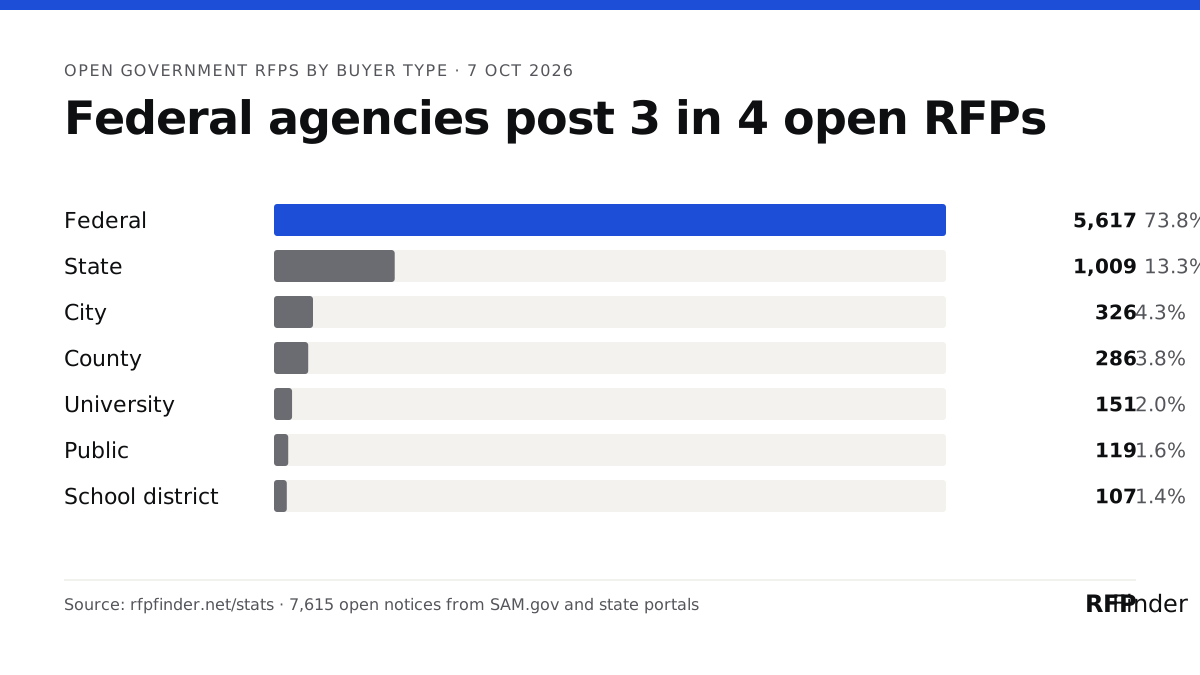
<a href="https://rfpfinder.net/stats/"><img src="https://rfpfinder.net/stats/img/buyers.svg" alt="Open government RFPs by buyer type, Oct 7, 2026" width="1200" height="675"></a>
<p>Source: <a href="https://rfpfinder.net/stats/">RFPFinder government RFP statistics</a></p>Who is buying
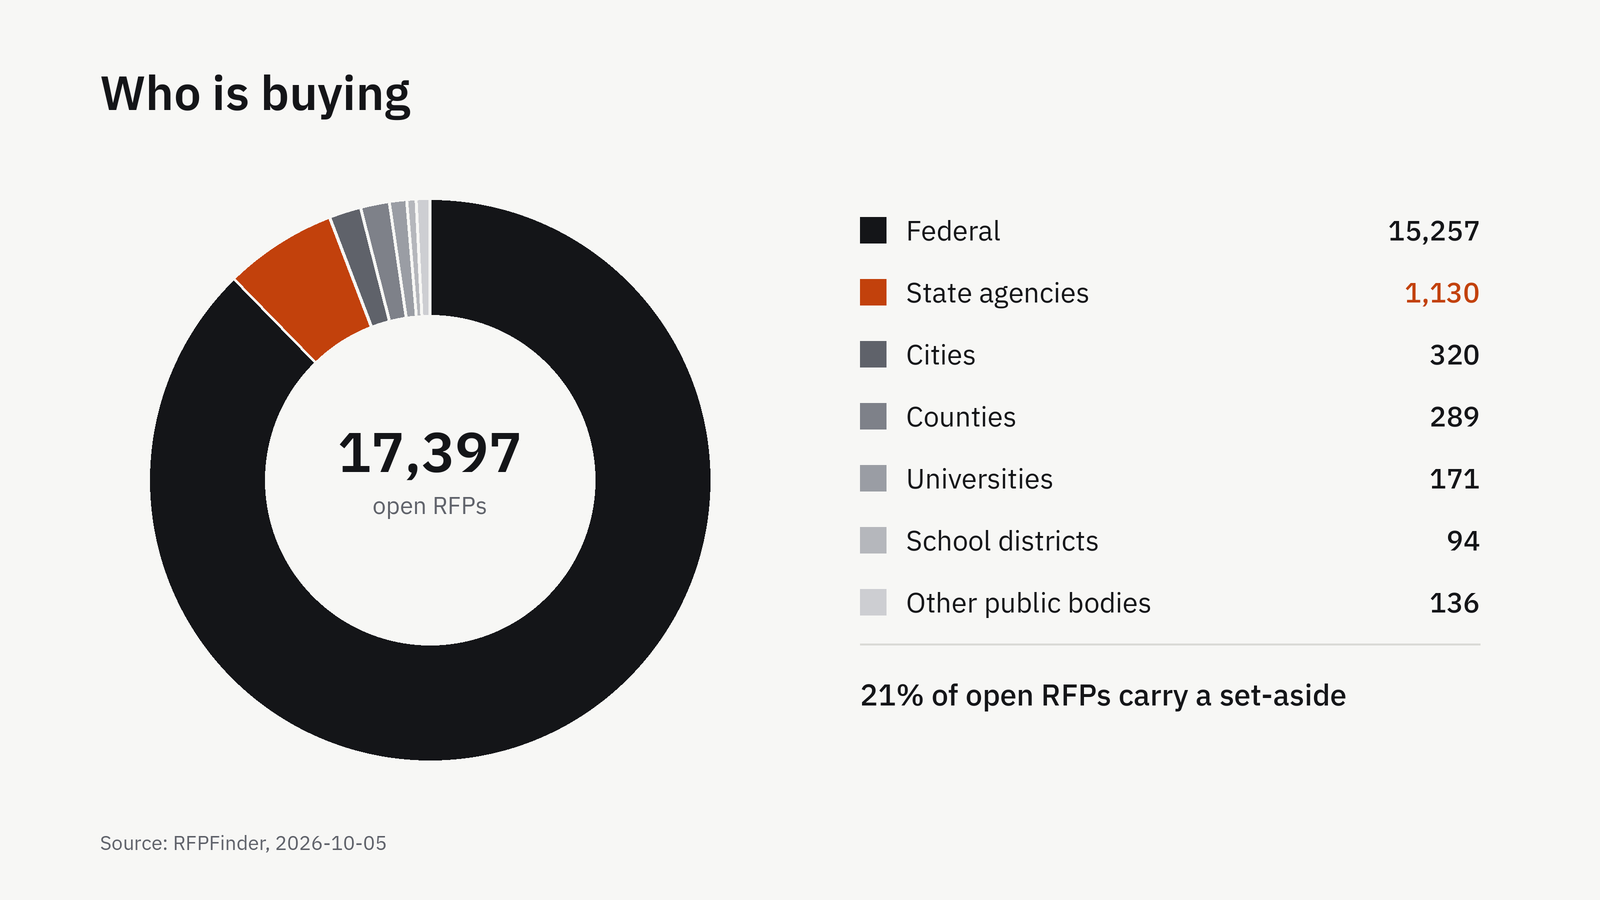
Open RFPs by buyer type. Federal notices dominate because SAM.gov covers every federal agency; state and local coverage grows as portals are added.
Download chart (SVG)Open RFPs by category
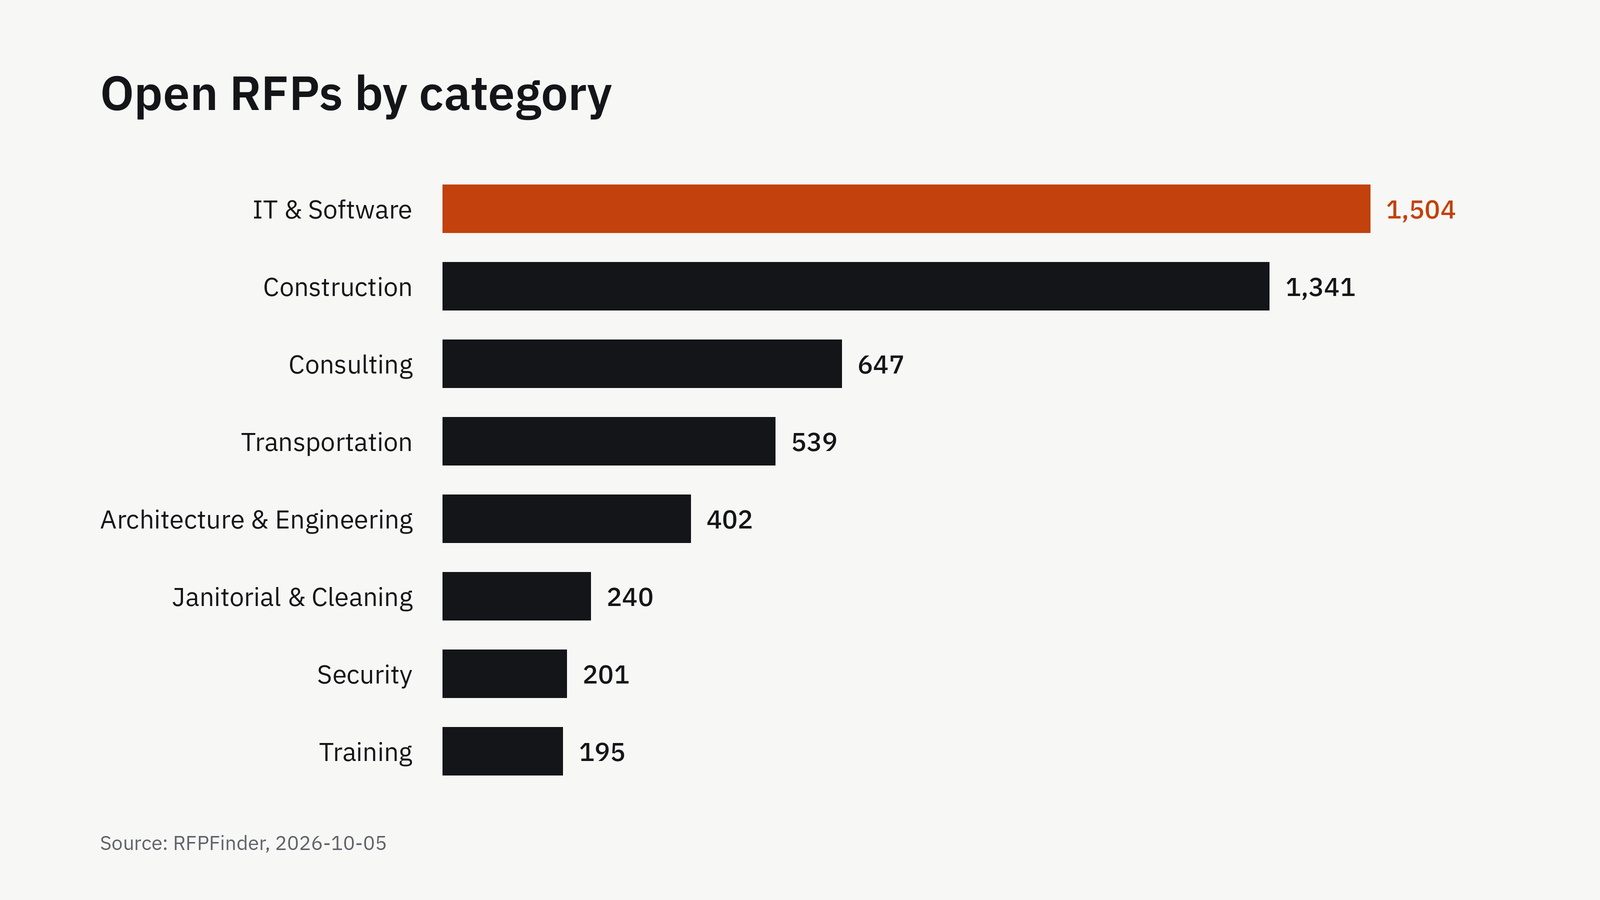
A notice can sit in up to three categories (from NAICS codes and our model), so counts add up to more than 7,615. Average value uses only notices with a stated estimate.
| Category | Open | Added, 7 days | Avg stated value |
|---|---|---|---|
| Supplies & Equipment | 4,096 | +1,868 | $7.6M |
| Construction | 1,012 | +276 | $4.0B |
| Equipment Maintenance & Repair | 621 | +167 | $320M |
| Consulting | 267 | +66 | $57M |
| IT & Software | 227 | +83 | $686M |
| Other | 201 | +55 | $133M |
| Real Estate & Facilities | 155 | +36 | $4.2M |
| Architecture & Engineering | 143 | +34 | $79M |
| Janitorial & Cleaning | 106 | +44 | Not stated |
| Landscaping | 103 | +46 | Not stated |
| Transportation | 100 | +27 | $23M |
| Nonprofit & Grants | 73 | +15 | $4.3M |
| Staffing | 53 | +23 | $150K |
| Training | 53 | +7 | $6.3M |
| Audit & Accounting | 36 | +10 | $56M |
| Security | 34 | +11 | $688M |
| Legal Services | 30 | +14 | Not stated |
| Event Planning | 29 | +13 | $100M |
| Marketing | 16 | +4 | Not stated |
| Printing | 14 | +6 | Not stated |
| Translation | 4 | +3 | Not stated |
| Website Design | 3 | +1 | Not stated |
Open RFPs by state
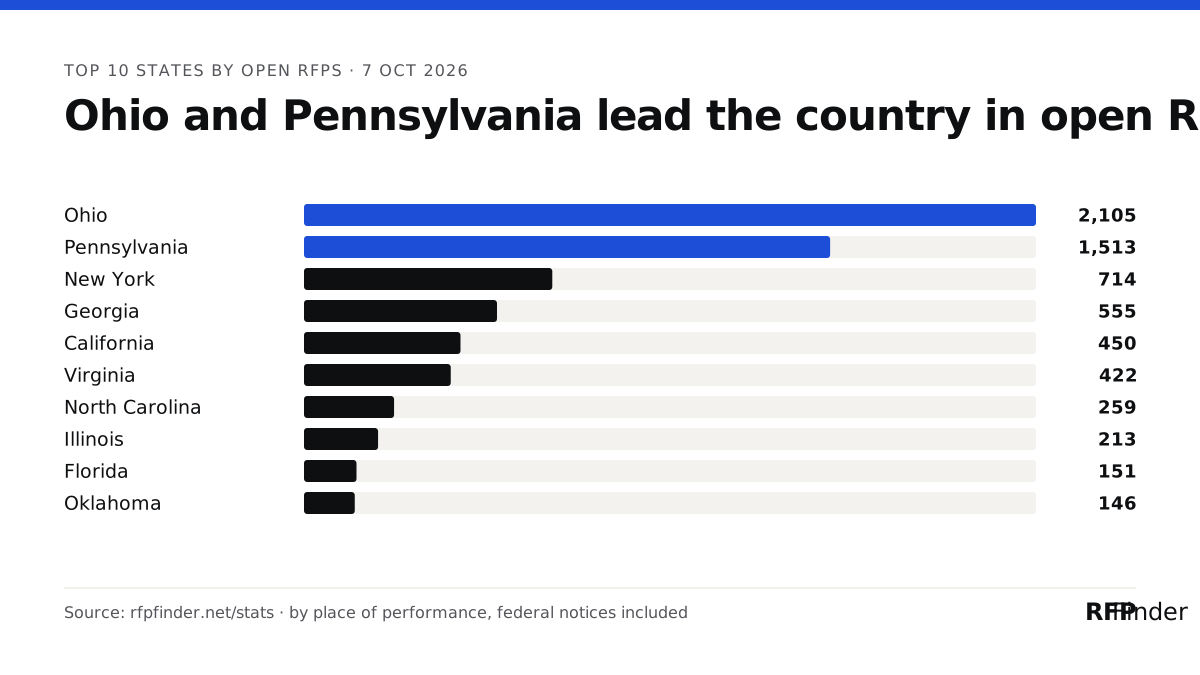
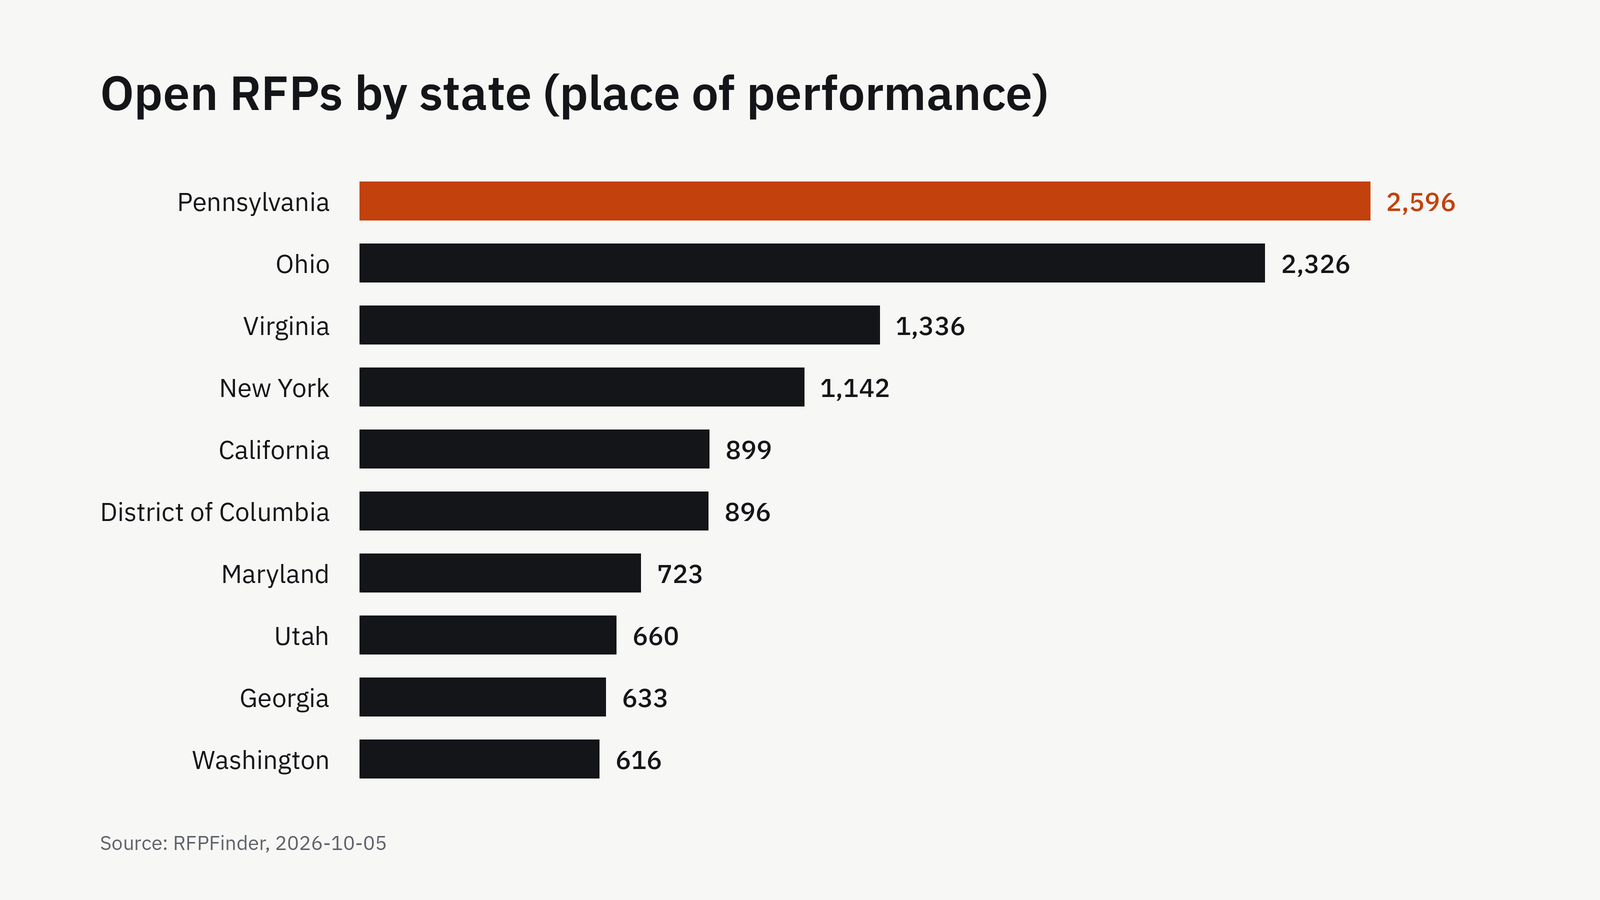
By place of performance: federal notices count where the work happens. Notices with no stated place are not included.
| State | Open | Added, 7 days | With set-aside | Agencies |
|---|---|---|---|---|
| Ohio | 2,105 | +1,401 | 1,083 (51%) | 8 |
| Pennsylvania | 1,513 | +421 | 303 (20%) | 7 |
| New York | 714 | +164 | 64 (9%) | 161 |
| Georgia | 555 | +145 | 9 (2%) | 233 |
| California | 450 | +374 | 52 (12%) | 69 |
| Virginia | 422 | +210 | 175 (41%) | 14 |
| North Carolina | 259 | +74 | 13 (5%) | 78 |
| Illinois | 213 | +123 | 26 (12%) | 29 |
| Florida | 151 | +30 | 19 (13%) | 36 |
| Oklahoma | 146 | +30 | 25 (17%) | 4 |
| District of Columbia | 122 | +29 | 28 (23%) | 20 |
| Louisiana | 90 | +1 | 3 (3%) | 5 |
| Maryland | 89 | +18 | 44 (49%) | 11 |
| Texas | 69 | +11 | 39 (57%) | 8 |
| Alabama | 53 | +10 | 12 (23%) | 4 |
Top 15 of 52 shownShow all 52
| State | Open | Added, 7 days | With set-aside | Agencies |
|---|---|---|---|---|
| Michigan | 48 | +10 | 22 (46%) | 6 |
| Utah | 46 | +9 | 13 (28%) | 5 |
| Washington | 42 | +9 | 21 (50%) | 7 |
| New Jersey | 40 | +14 | 12 (30%) | 4 |
| Colorado | 36 | +4 | 12 (33%) | 7 |
| Missouri | 29 | +6 | 15 (52%) | 6 |
| Wisconsin | 21 | +10 | 11 (52%) | 3 |
| Hawaii | 20 | +4 | 9 (45%) | 4 |
| Oregon | 19 | +3 | 14 (74%) | 8 |
| New Mexico | 19 | +5 | 11 (58%) | 5 |
| Massachusetts | 19 | +8 | 12 (63%) | 6 |
| Tennessee | 17 | +5 | 3 (18%) | 6 |
| Mississippi | 17 | +6 | 8 (47%) | 6 |
| Idaho | 17 | +4 | 11 (65%) | 5 |
| South Carolina | 15 | +1 | 7 (47%) | 5 |
| Rhode Island | 15 | +6 | 4 (27%) | 2 |
| Nevada | 15 | +4 | 7 (47%) | 4 |
| Arizona | 15 | +5 | 9 (60%) | 4 |
| Nebraska | 14 | +4 | 8 (57%) | 3 |
| Indiana | 14 | +1 | 9 (64%) | 5 |
| South Dakota | 12 | +3 | 9 (75%) | 6 |
| Arkansas | 11 | +3 | 7 (64%) | 2 |
| Wyoming | 10 | +1 | 6 (60%) | 4 |
| Kentucky | 9 | +1 | 5 (56%) | 4 |
| Iowa | 9 | +0 | 0 (0%) | 2 |
| Alaska | 9 | +1 | 6 (67%) | 6 |
| Montana | 8 | +4 | 3 (38%) | 4 |
| North Dakota | 7 | +2 | 4 (57%) | 3 |
| Maine | 6 | +2 | 4 (67%) | 2 |
| Delaware | 6 | +0 | 3 (50%) | 2 |
| Minnesota | 5 | +2 | 0 (0%) | 3 |
| New Hampshire | 4 | +2 | 2 (50%) | 2 |
| Kansas | 4 | +1 | 3 (75%) | 2 |
| Guam | 4 | +3 | 3 (75%) | 1 |
| Connecticut | 4 | +0 | 3 (75%) | 2 |
| West Virginia | 2 | +1 | 1 (50%) | 1 |
| Puerto Rico | 2 | +0 | 1 (50%) | 2 |
Method and sources
- SAM.gov
- Daily public extract each morning; the Opportunities API checked every 3 hours for new postings
- State and local
- Portals and agency bulletins checked every 6 hours; open-data registers synced daily
- Excluded
- Award notices, archived notices and anything past its deadline; near-duplicate postings are hidden behind the newest
- Values
- Averages include only notices with a stated estimate; most notices state none
The full list with last-fetch times and 7-day counts is on the coverage page.
Cite this page
Free to quote with a link. The charts and CSV downloads carry the same numbers and date.
RFPFinder, "Government RFP statistics", 2026-10-07, https://rfpfinder.net/stats/